
Implementing Data Quality

This is the second of our two-part series about data quality. In part 1, we covered various aspects of Freedom Financial Network’s continuous data quality improvements and the challenges and issues caused by poor data quality. Here, in part 2, we will discuss how we went about implementing data quality for our data warehouse’s extract, transform, and load processes.
To ensure data quality across a wide range of tools and data sets, it is important to create an independent service that can handle a wide range of requests, as well as integrate with various ETL tools. By doing so, we can ensure data quality standards are met across the entire data warehouse.
Let’s look at each component of our data quality service and analyze why and how it was built and the advantages it provides.
API layer
When creating the actual microservice to handle data quality check requests, we wanted it to accomplish the following four things:
Handle many types of requests.
Ensure a primary key is valid, check for nulls/blanks, or that the table row count meets the expected count.
Add new checks into the service.
Integrate different ETL tools with our service, including Airflow, Matillion, or custom built services.
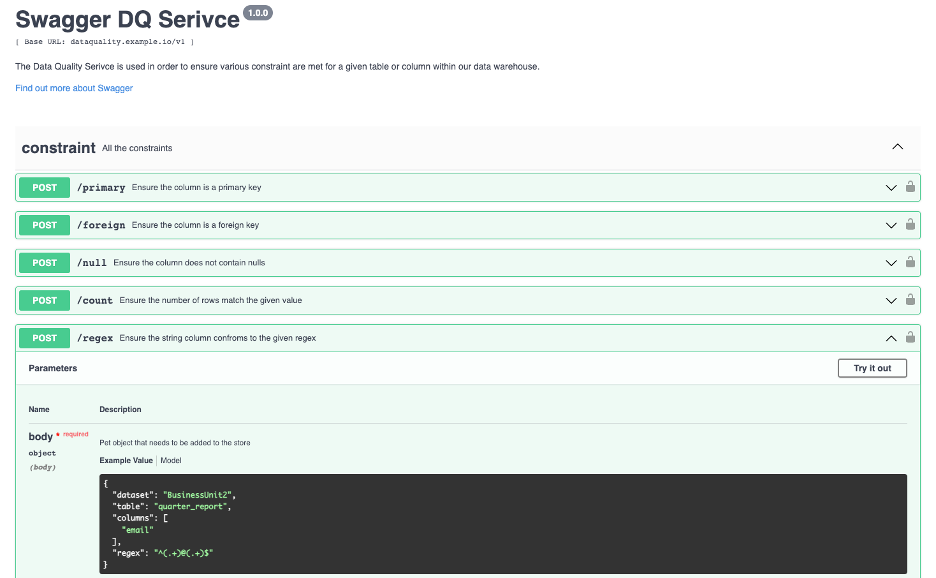
With these requirements, we wanted to create a service with an endpoint for each quality check – one for primary keys, one for nulls, one for duplicates, etc. By doing this, it would be simple to continuously add new endpoints without affecting any existing endpoints. In addition, using a REST API would provide the flexibility to integrate with just about any modern ETL tool.
Another decision that was made regarding the API was how the service would check data. You could make an argument saying that the data could be passed into the API to be checked, and so the data location would not matter. However, for our purposes, given the vast size of the data, as well as the fact that all our data sits inside the same data warehouse, the best option was to pass the data’s table location as parameters. Then, the API would be able to create a connection to the data warehouse and perform the checks using that infrastructure. This allows for very low latency requests being sent to and from the service.
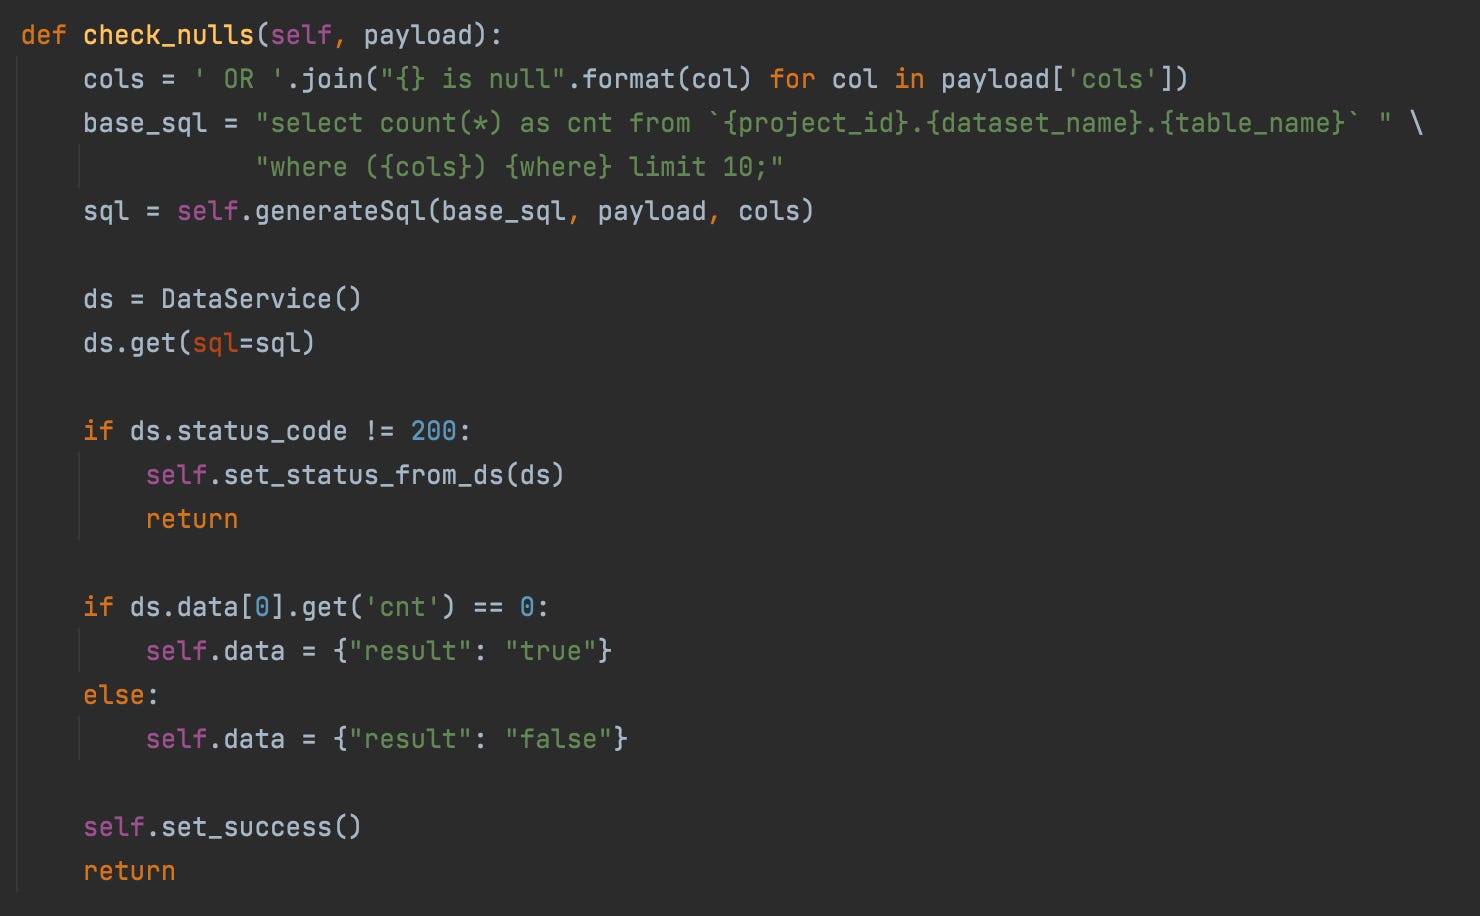
Code Snippet for Null check
Pluggable Components
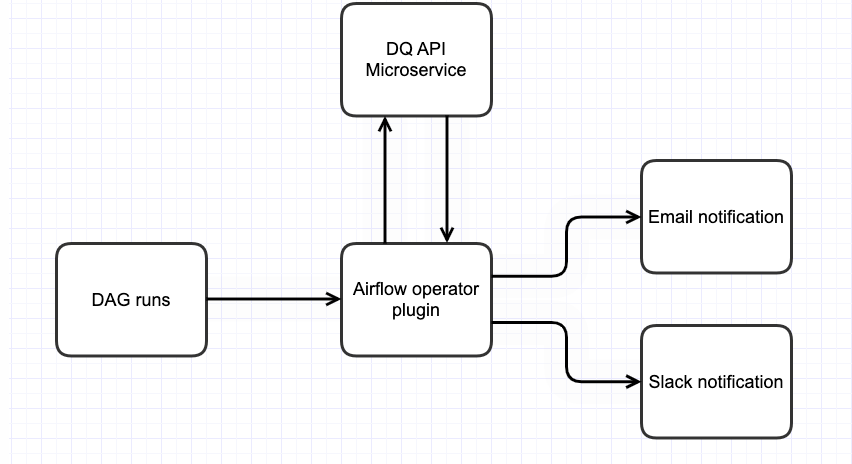
Once the API layer was built, the next step was to create simple plugins for the ETL tools that are being utilized. We are using Apache Airflow for ETL Pipeline orchestration. To create the plugin, we created a custom operator which can be placed as an individual task within an Airflow DAG. The operator is responsible for two steps:
First, to call the API with the data passed to get a True or False response.
Second, to alert the team via email or slack based on the trigger conditions.
By having a custom operator that can be placed as a task anywhere in the pipeline, engineers have the flexibility to place these checks where they best fit. Placing a data quality check after an extraction will allow you to ensure data quality as soon as the data is placed in the warehouse. Another option is to place the task before any distribution takes place. If you have a pipeline that sends out data, having a quality check prior to the final step of sending ensures that those receiving the data have full trust in its quality. Although these checks can be placed anywhere, best practice is to place them in areas susceptible to Data Quality issues (like critical data ingestion pipelines) or critical extraction steps (like external investor reporting).
While we specifically discussed Airflow in this section, the great thing about this approach is it can be utilized by just about any modern ETL. Most tools will have some parallel to Airflow’s tasks. Using the same approach, we can create a custom task, operator, or step, whose job is to take in the parameters that define the quality check and execute a call to the API.
Alerting and Monitoring
Finally, when it comes to ensuring data quality standards, it’s important to make sure data engineers and the consumers involved are notified when these standards are not met. This can be done at the individual check level, where the team that set up the check gets notified of failures. It can also be at a high-level view where we can see all the checks that have been performed in a given timeframe.
For example, the Airflow plugin also sends emails and Slack notifications. This is done within the plugin itself, since it is the best way for Airflow to alert on the results of the API. However, some tools may handle alerting differently. If a tool already has extensive pre-built plugins, which help send alerts to the channels used by your organization, then it would be best to make use of those.
When alerting for individual checks, it is important to look at the ETL tool you are working with and have a plan around how the custom plugin, which calls the APIs, will use that result to trigger alerting. That way the teams who set up the alerts are notified any time there is a failure.
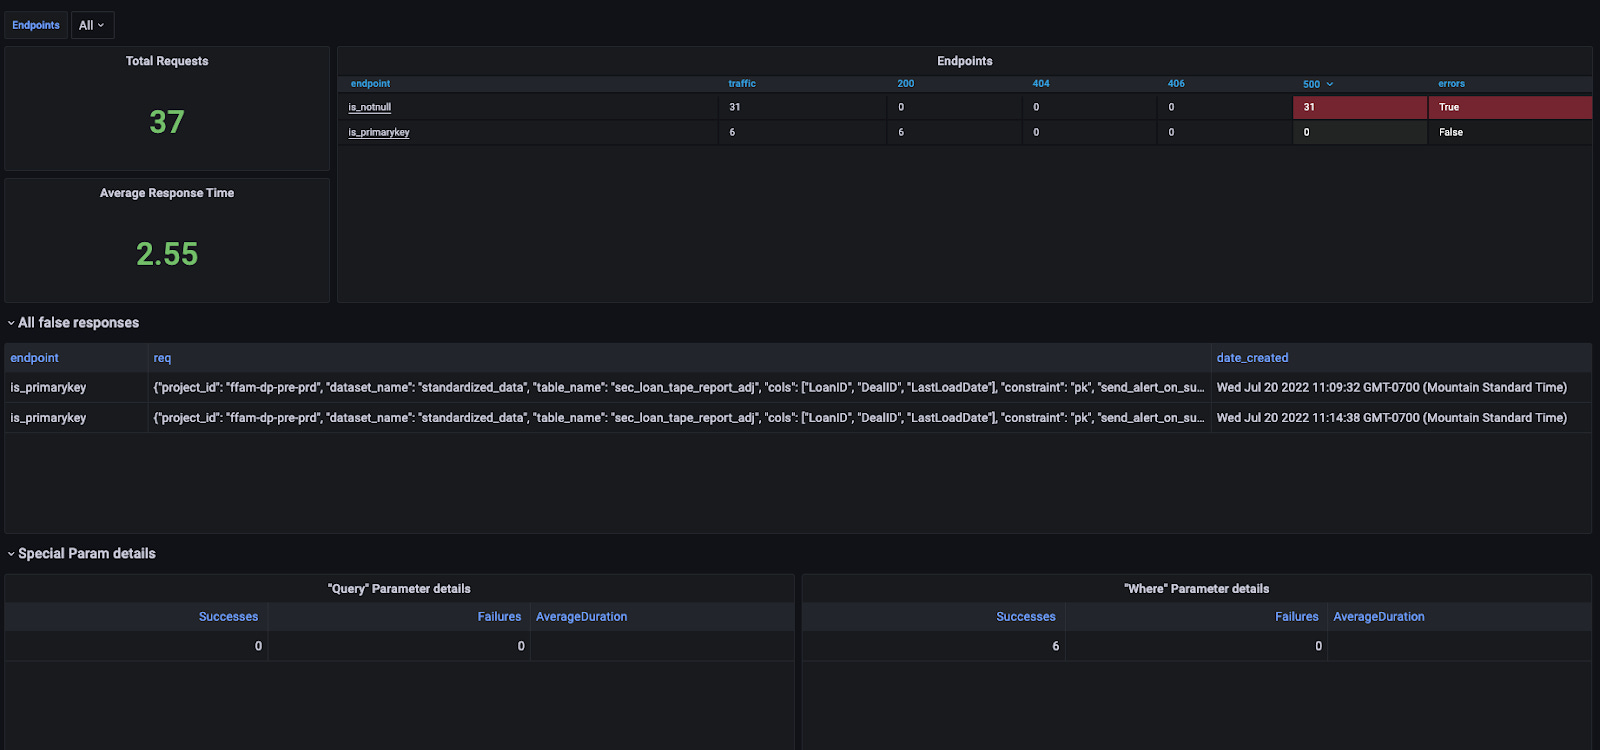
For getting a more high-level view, it’s important to have alerting and monitoring set up at the API layer to ensure the health and stability of the microservice by checking response times, volume, error code, etc., as should be done for any production microservice. However, it’s also beneficial to have a view into the results of the quality checks themselves. Being able to see how many failures there are, what type of checks are failing, and receiving alerts when the failures become abnormally high are all ways for you to get a high-level picture of the data warehouse’s quality.
In Summary
By splitting the service into two parts, the API microservice and the ETL plugin(s), we can have maximum flexibility with both the number of quality checks we have, as well as the number of tools that can integrate. We also have the flexibility to alert on the channels our organization utilizes most. Since implementing, we have seen various data quality alerts pop up which have allowed us to quickly fix issues that may have otherwise gone unnoticed. This is just the beginning. We have already expanded the types of checks and added data return, which allows engineers to see the data that caused the check to fail. Looking toward the future, we have plans to add even more types of checks, provide option threshold values for certain checks, expand alert channels for plugins, DQ checks on data files, and much more. As more engineers in the organization begin to adopt this tool, there is no doubt it will continue to evolve.
We hope this gives you an idea of how the Engineering team at Freedom approaches these decisions and creates innovative solutions. Interested in an Engineering role at Freedom? Come join us!